Table of Contents
Why Did Official Poverty Fall While Household Income Set a Record?
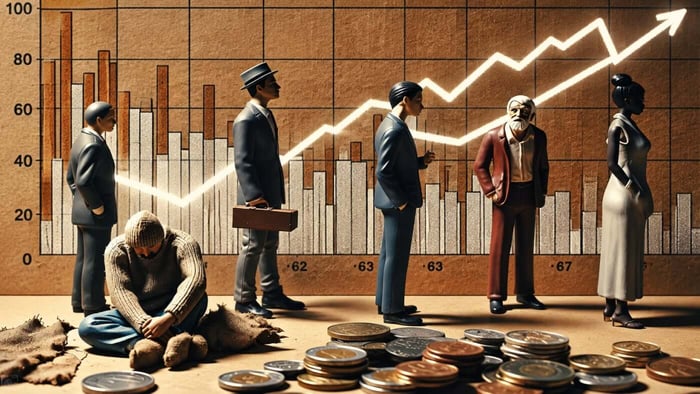
Because pretax money income at the middle of the distribution rose faster than the inflation-adjusted threshold. On September 15, 2026, the Census Bureau released Income, Poverty and Health Insurance Coverage in the United States: 2025. Real median household income was $87,460, up 2.6 percent from $85,210 in 2024 and the highest reading since the series began in 1967. The official poverty rate fell 0.5 percentage points to 10.2 percent. That is 34.5 million people below the official line. The weighted average threshold for a family of four was $32,970.
What the 2025 Census Numbers Show
The official share of children in poverty fell to a historic low of 13.4 percent. The official Hispanic measure fell to a historic low of 13.9 percent. Those two records sit beside household-income gains of 3.0 percent for White households, 2.9 percent for non-Hispanic White households, and 4.8 percent for Black households. Median income for Asian and Hispanic households did not change by a statistically significant amount.
Post-tax median household income rose 3.1 percent, from $73,760 to $76,060. That series is not a record; stimulus years still sit above it. Median earnings for full-time, year-round workers as a whole did not move significantly. Women’s earnings rose 3.2 percent. The uninsured share for the full year was 7.9 percent, or 26.7 million people, not statistically different from 2024. The Supplemental Poverty Measure was 13.1 percent, also not statistically different from 2024. Social Security remained the largest program moving people out of SPM poverty, 28.8 million in 2025.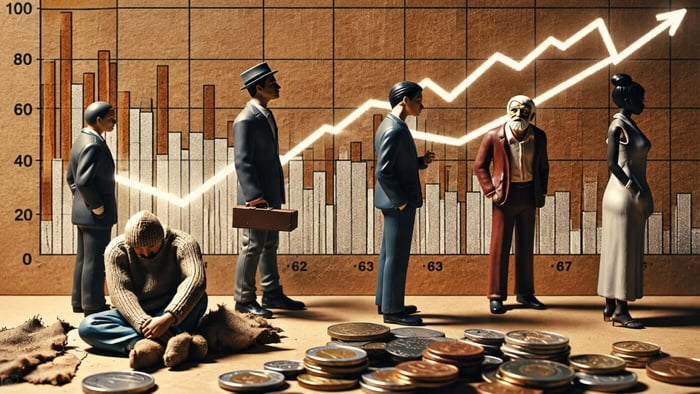
How Official Poverty and the Supplemental Measure Diverge
The official poverty rate is pretax cash against a national threshold that varies by family size. The SPM is higher because it subtracts necessary expenses and adds in-kind and tax benefits, and because housing costs vary by place. The SPM exceeded the official measure in 26 states and the District of Columbia. That gap is a measurement fact, not a veto of the official decline. The official poverty rate still fell. The child and Hispanic official lows still stand. Calendar year 2025 was the first full year of President Trump’s second term. The Census tables do not assign credit. They record that inflation-adjusted midpoints rose and that the official cash-poverty share fell half a point.
Strategic Implication of a Record Median and a Lower Official Line
A record median and a lower official poverty rate together describe a year in which more households cleared a cash threshold that itself moved with prices. They do not describe how households felt about groceries or rent. They do not describe SPM, which held steady. The official poverty rate is 10.2 percent. The median household is at $87,460. Those are the numbers the Census Bureau put on the record for 2025.
Read more: https://morsereport.com/a/news/trump-warns-of-us-depression-if-democrats-win-midterms
Republic Trucker Hat - Navy / White

$45.00
SHIPPING FOREWORD: Because all Morse Report products are 100% sourced and manufactured inside of the United States of America at the highest standard of excellence, shipping fulfillment can take anywhere from 5 - 14 days, depending on conditions. THANK YOU!… read more
FAQs
Why Did Official Poverty Fall While Household Income Set a Record?
Because pretax money income at the middle of the distribution rose faster than the inflation-adjusted threshold. On September 15, 2026, the Census Bureau released Income, Poverty and Health Insurance Coverage in the United States: 2025. Real median household income was $87,460, up 2.6 percent from $85,210 in 2024 and the highest reading since the series began in 1967. The official poverty rate fell 0.5 percentage points to 10.2 percent. That is 34.5 million people below the official line. The weighted average threshold for a family of four was $32,970.